Using ALE algorithm and machine learning to classify need and desire states
By Laurence Grenier
Published on September 3, 2021
| Last updated on
December 19, 2022

Using ALE algorithm and machine learning to classify need and desire states
Personal background
My name is Laurence and I’ve completed a bachelor’s degree in cognitive neuroscience at Montreal University. I am currently a master student in psychology at Montreal University. I am particularly interested in social neurosciences, thereby working at the NeSC (Neuroscience en contextes sociaux)lab. My master project is a coordinate based meta-analysis on social hierarchy.
I really wish to contribute to scientific findings by adopting approaches that consider the current issues of reproductibility and social inclusion in neuroscience! I’ve decided to do brainhack school in order to familiarize myself with coding and neuroimaging data.
Project Definition
Using ALE algorithm and machine learning to classify need and desire states
Theoretical background
Overconsumption is associated with several environmental, social and individual problems (Lipschutz, 2001). One explanation suggested for overconsumption is that “we consume what we want belong what we need” (Stearns, 2006), (Juvénal et al., 2021). Some stimuli are sought for their survival value (food, water,…), while others are sought for their reward value (money, interesting objects,…). While motivation towards the former seems to increase, or even be triggered, by a state of deprivation, motivation towards the latter seems to increase as a function of the previously learned value of the stimulus, corresponding to the association between this stimulus and a reward. However, since a stimulus can be pursued for its needing value AND for its wanting value, for example some kind of food, or even some activities, we can wonder what are the similarities and the differences between those two conditions at a neural level?
To answer this question, we previously made a coordinate-based meta-analysis with the ALE (Activation likelihood estimation) algorithm in order to find the consistent activations reported in the literature for each of those conditions. Therefore, we identified regions more commonly reported in the experiments regarding needs than in the expriment of wantings, vice versa.
ALE
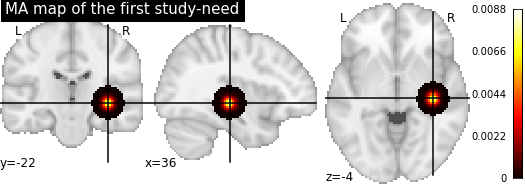
The ALE approach is used to show the convergence between the regions reported in the literature of a specified topic. For each of the selected studies, the coordinates of the significant voxels are taken (activation peaks). Then, the algorithm is making a gaussian matrice representing the spatial uncertainty, based on the sample of the corresponding study, around the activation peaks reported and thus making what is call a MA map (main activation map).Therefore, each of the experiment has it own MA map where each voxels is associated with an activation probability (that increase in the closest to the peaks).Then, the union of the MA maps are taken and the algorithm is making permutations to identify which activations peaks are significantly reported across the experiments, thus representing the convergence of activations.
Objectives
The goal of the present project is to build a machine learning model which will make the distinction between the studies focusing on the needs and the studies focusing on the wantings based on the MA maps generated by ALE algorithm during the first step.
The puposes of this project are :
- Build a machine learning model which will classify the needs and the wants state based on studies included in the meta-analysis to train the model.
- Retrieve the most contributing features in the machine learning classification model and interpret the coefficient’s value in comparison of ALE meta-analysis results.
- Familiarize myself with open science pratices, programming and machine learning.
Tools
- Python
- Jupyter notebooks
- nilearn
- scikit-learn
- github
- nimare
Data
The dataset is composed of all the activation peaks of included studies in the meta-analysis.
needs : 38 studies Contrasts of interest were meeting those criterions:
- Perception of a food stimulus during a hunger state > perception of a stimulus during a satiety state.
- Perception of a food stimulus during a hunger state > perception of a non-food stimulus during a hunger state.
wantings : 33 studies Contrasts of interest were meeting those criterions:
- Perception of a cue announcing a reward (or a larger reward) > perception of a cue not announcing a reward (or a smaller reward).
Here’s all the coordinates of the sample in the brain.
- Green : Needs
- Red : Wants

Deliverables
At the end of this project, I’ll get :
- Markdown README.md for the description of the present project
- Jupyter notebook including the code, and the brain images
Results
Summary

Data preparation
- Transform all of the activation peaks of each study into a MA map with nimare.This ended up with 71 MA map, because 71 studies had been included.
- Apply a mask to select the voxels of the grey matter. I used the MNI152 mask
Here is an example of a MA maps with the mask:

Machine learning
I used a linear support vector classification to build the model.
At first, the model classified all the data into needs. This problem occurred maybe because the value of most of the voxels is zero, or close to zero (as you can notice in the above MA map). By arranging the data in order to increase the gap between the null voxels and the non-zero ones, the classification has been improved.
Finally, the model predicted the data with an accuracy of 83.3 ± 16.6 %.
There are the confusion matrices that shows the results:

Interpretation
Even if the accuracy is quite good, because the dataset contains more needs than wants, the model have initially more than 50% of accuracy if it classifies all the data into needs. Therefore, we should be careful with the interpretation of that accuracy value. This also explains why the model never classifies the needs into wants and why it is only making errors by classifying the wants into needs. A solution to overcome this problem would be to balance the weight of the different conditions according to the proportions in the dataset.
Moreover, I’ve split the data into training set and test set by myself with a proportion of 75% for the training set and 25% for the test set, and I’ve split again the training set into 60% training set and 40% validation set. Thus, the model is not optimal, because it is only learning with 45% of the initial dataset, which is quite small when having 71 data. A cross-validation method would have been more efficient in that case.
Features importance
There you can see the most contributing features on the brain. The more the region is yellow clear, the more changes in the value of that voxel influence the decision of the model.

Tools I learned during this project
- Python
- Packages to run machine learning with scikit-learn
- Packages ro run meta-analysis on python with nimare
- Tools to create great brain images and data visualization (matplotlib, seaborn…)
Conclusion
In conclusion, the objectives of my project are mostly reach. Even if the model is not optimal and few modifications should be applied to improve it’s validity, I’ve succeeded in building a machine learning model and in formatting the initial data so the model can process them.
Finally, I’ve started this course without a significant background in coding and a little fear about it (I admit). One of my motivation to do brainhack school was to demystify this field in order to be ready to make great neuroscience! I’m glad I did it, learned python and many useful packages to analyse and play with neuroimaging data.
I really want to thank BrainHack School team for their remarkable competence and exceptional support during all the course!


